Querying Compound Finance metrics with Dune Analytics (PostgreSQL)
Last year I discovered Dune Analytics, but forgot to blog about it. Dune is a blockchain querying interface, which I’ve been waiting for since I first learned about crypto and data analytics in 2017. Dune encapsulates open finance values, such as transparent accessible data, open-source real-time intel, distributed ledgers. So when I was given some questions to query on Dune as part of a job application, I was excited to try this very pleasant way of accessing everything happening on blockchain. Here is how I approached the assignment and then some. Final result
One of the biggest hurdles to overcome was understanding what tables hold the relevant data. A lot of this can be achieved with just the search bar, but understanding the functions of the protocol and the events it emits gives a more comprehensive view. Compound is (or at least was) a relatively straightforward protocol as it’s transactions don’t call many other protocols in order to execute.
One way to learn about the functions of a protocol is going into the contract tab on the protocol’s page on etherscan. The functions listed there more or less correspond with the decoded tables on Dune. 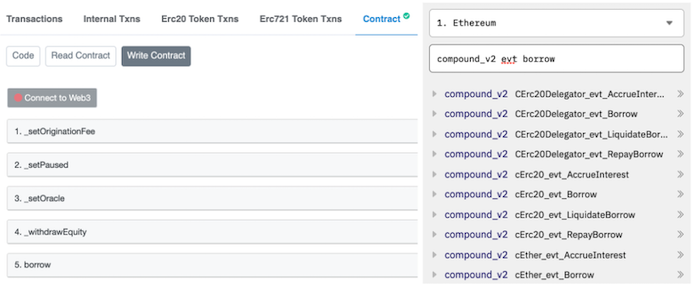
Once I know what the relevant tables are, I look at individual transactions and cross-reference them with their Etherscan pages to make sure the decoding in my query reflect the “truth”. ![]()
To give more details, this was my process querying question 1 in assignment prompt:
- First, the innermost subquery (liq_events) gets all the liquidation events from the LiquidateBorrow tables for different tokens (“cEther_evt_LiquidateBorrow”, “cErc20_evt_LiquidateBorrow”, “CErc20Delegator_evt_LiquidateBorrow”); it returns amounts denominated in cTokens.
- Next we JOIN the view_ctokens table to get the underlying token addresses.
- This gives us a way to then connect to ethereum.transactions table to get decimals for the debt assets and prices.usd and dex.view_token_prices tables to get prices, ending in the liq_info subquery. It wasn’t obvious to me right away that cTokens’ prices are different from the the prices of their underlying tokens and that they have to be divided by a different decimal (that’s why cTokens’ decimals are hard-coded to be divided by 10^8 instead of 10^18 or 10^6). Price tables have to be joined on the same fragment of time. Contract logic is such that the liquidators are seizing cTokens, and then have the options to swap. In calculating the profit I assumed the seized collateral was sold immediately.
- We do the calculations for profit (value of collateral to claim = value of debt to repay * (1+ discount)) and loss (gas spent) and wrap it all up in liq_pnl CTE.
- Now all that is left to do is to group and sum.
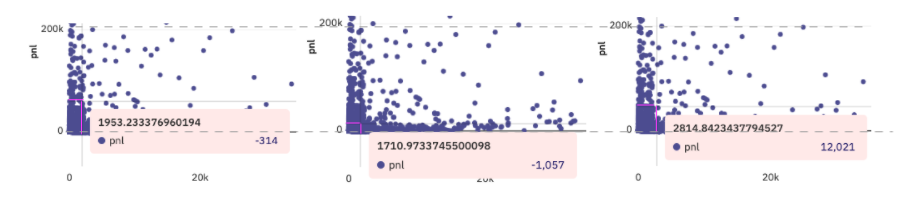
PS I noticed a distortion in Dune’s rendering functionality on my gas and PnL graph. The scaling is a bit off: only y points < ~1,000 show up below zero. More importantly, a y axis point = -314 (on the left screenshot) appears higher than y = -1,054 (center) and at the same time so close to y = 12,021 (right). I asked the question on dune’s discord and a “wizard” told me that “when you have that many data, scatter doesn’t really work well”. That graph had 9255 data points.