Sales analysis for a small beach cafe in New York
Fruteria is a seasonal beach cafe in NYC that serves breakfast and healthy fare. For the last three summers they’ve been using Square app to process their sales. I wanted to look at some key metrics to get a sense of the business, see how it has been growing and what can be done to help it grow further. In addition, I want to look closer at Summer of 2018 when half a mile of the beach in front of the cafe was closed to beachgoers due to the sand erosion and verify by how much it has hurt this small business.
1. How does the company make money?
The revenue is realized from daily sales, for about 4 months a year, with July the best performing month every year. The total sales, as well as total transactions, have indeed suffered in 2018, by 5.8% and 7%, respectively. In terms of average daily sales, this year has already beat 2017 and 2018 by 12% and 28%. Top 5 biggest sale days in 2019 have been bigger than top 5 biggest sale days in 2018.
This is how the three years compare in weekly transaction volume:
![]()
This type of graph is not available in Square’s dashboard (when you choose a three year date period it will first show a graph for one year but title it as the three year period you specified, and upon refreshing it will say “Reports can only be shown for a period of one year or less”).
One business question interesting to the owner was how busy each time of day is on different days of the week? Drawing from the data from all three years, any Sunday hour is busier than any other hour of any other day. It also shows an opportunity to boost sales by sustaining the busyness after 3PM, perhaps by offering more substantial, lunch- or even dinner-like meals.
![]()
2. Who is the customer?
This cafe was the first place to serve good coffee in the area, which allowed them to develop a loyal following, among the local, as well as city folks, which I can attest to myself, being one of those people. To pinpoint the exact number is a little tricky, considering only half of transactions are paid with card and thus identifiable (the proportion grew from 30% two years ago). So when looking at customers, we only look at part of the data. So out of those who are identifiable, about 15% return within the same year, 6.5% came two of the three years and a little more than 1% came all three years. By comparison, even for the largest restaurant chains, the majority of customers don’t come back within the next 6 months after a visit.
Total unique number of visitors, has growing proportionally to the number of transactions paid by card. Percent of transactions where customers left tip on the card rose from 17% to almost 30%.
Most exciting is to know the power users: customers with most transactions, most spending customers and most tipping customers. Using this basic ranking and analysis techniques below can help retain the power users, perhaps with incentives, such as discounts, and stimulating the conversion of the rest of the existing customers into high-value customers.
One established way to think about customers is using the customer lifetime value (CLV), the net profit attributed to the entire future relationship with a customer. It’s estimated that repeat loyal customers increase profitability by 25-125%. For short lifecycle business as a cafe, however, the CLV will be low. In our case, the average is almost $20, while maximum is $2700 and minimum is $0.07. By comparison, Starbucks’ average CLV is close to $14k.
Another way to look at customers is RFM analysis - a segmentation technique that identifies different types of customers to then interact with each type more meaningfully. It uses past purchase behavior to divide customers into groups by recency (R, time since last purchase), frequency (F, total number of purchases) and monetary value (M, total monetary value). To perform RFM analysis, we divide customers into four groups according to the three parameters, creating 64 (4x4x4) different segments.
Segment with code 111 are the best customers because they purchased most recently (R=1), purchased most quantity (F=1) and spent the most (M=1). Almost 5% of the cafe’s customers are the best type of customers! The three most popular segments, with more than 7% of customers each, are:
- 343, ones that haven’t purchased in a while (almost lost), bought few and not big spenders
- 143, ones that came recently, but not loyal / frequent, not big spenders
- 243 relatively recent, but not loyal, not big spenders
3. How does the product work?
There were almost 12% less of total amount of items ordered in 2018 than in 2017 and 2019 has yet to catch up. Most customers purchase only 1 item, which is an opportunity to boost sales via complementary items, such as combo deals.
Over the years, percent of refunds, as well as accidental charges, out of total transactions of the same year has been falling (from .1 to .07 to .03. and from .06 to .03 to .01, respectively).
These are the three most important categories of items per hour of the day: 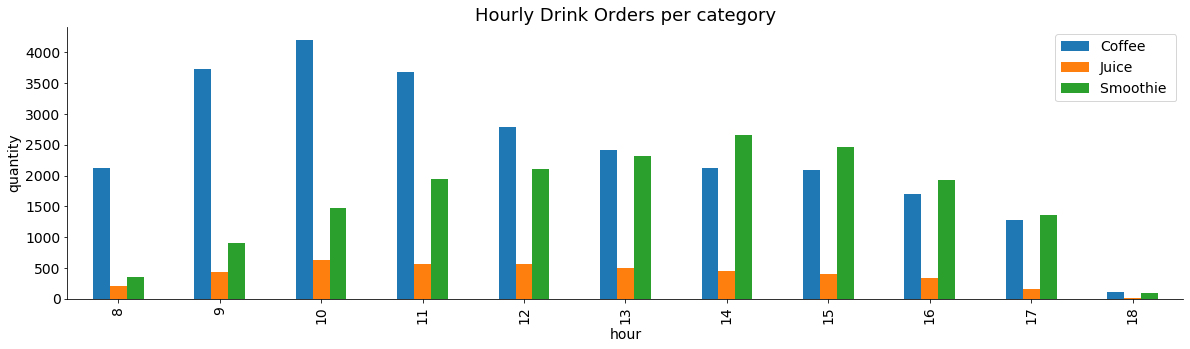
We also know favorite items of top customers, top-selling items in their category, and all-time best selling items: Strawberry Mango smoothie, Iced Coffee and Breakfast Sandwich! I can have all three of them any day.
Conclusion: I think there are opportunities for Square analytics to work closer with small business, and customize the dashboards according the different domains’ needs.
SOURCES:
- https://www.blastam.com/blog/rfm-analysis-boosts-sales
- https://pos.toasttab.com/blog/customer-lifetime-value
- https://upserve.com/restaurant-insider/restaurant-guest-lifetime-value/
- https://towardsdatascience.com/find-your-best-customers-with-customer-segmentation-in-python-61d602f9eee6